Saturday, October 1, 2011
Wednesday, August 24, 2011
Tuesday, August 16, 2011


Sunday, August 14, 2011
Monday, July 18, 2011


Thursday, July 14, 2011
Multisim
Multisim is a circuit simulation software for both digital and analogue system. Through this virtual simulation, it ease the designer in designing as the designer can add and remove devices at any time.
Figure 1 shows the interface of Multisim. The highlighted red box is where the devices are located. With the Multisim V11.0, a lot more devices simulation are supported which includes PLC, and also some PIC16F microcontrollers.

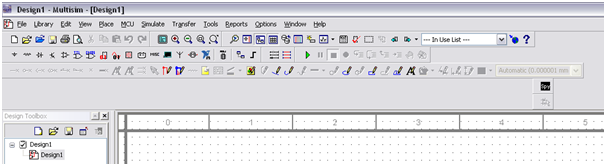
Figure 1: Multisim Interface
Having devices is not sufficient to get data. Thus, Multisim includes various virtual instruments such as oscilloscope, multimeter and spectrum analyzer. Some of these instruments are based on instrument manufacturers such as Agilent and Textronix. Figure 2 shows the various instrument toolbar located at the right.
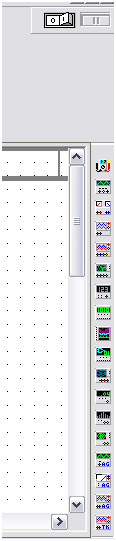
Figure 2: Instrument toolbar
Below is an example of a Bar Graph Display of AC signal. The AC signal will be produced by the signal generator and the signal wil be measured by an oscilloscope. Additionally, the amplitude of the signal will determine the display of the Bar graph. Devices and virtual instrument can be easily selected from the device toolbar and the instrument. The devices and instrment which are selected is put into the layout and connected.
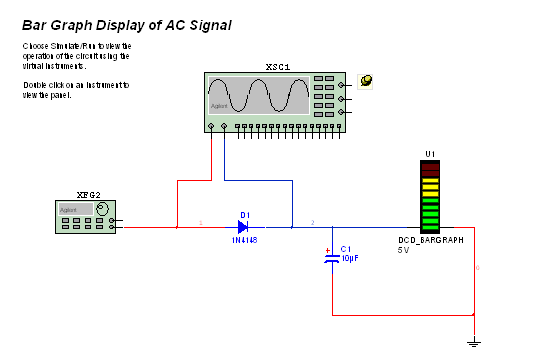
Figure 3: Simple circuit example
Based on Figure 4, the oscilloscope which is used is from agilent. Besides that, the model also have the same layout of the original model.
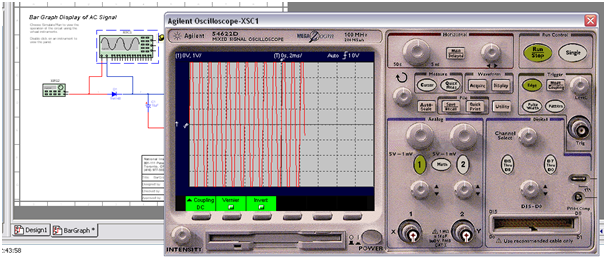
Figure 4: Simulation of the circuit on oscilloscope
The signal generator which is used here is also from agilent which has the same layout as the original hardware.
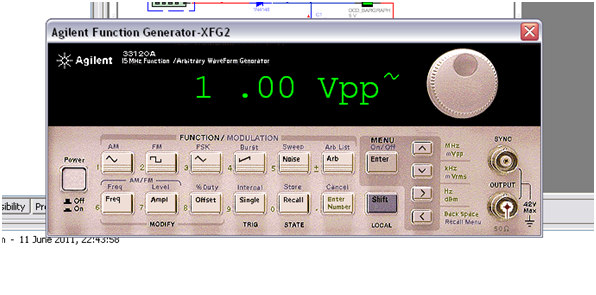
Figure 5: Signal generator
Figure 6 shows the simulation. During simulation, you can manipulate the virtual instruments and view the results similar to what is shown on the oscilloscope and other output devices on the layout.
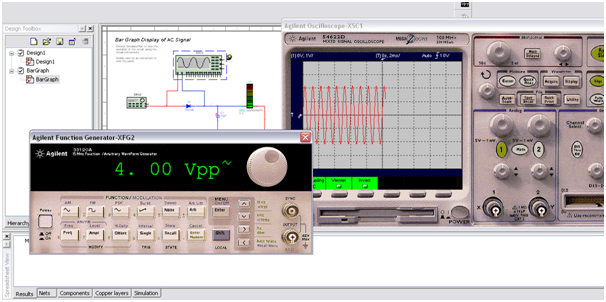
Figure 6: Result of the signal generator in oscilloscope
With this simulation software, circuit design and testing can be simplified as real hardware is not required. And the analysis can be done remotely with other engineers and designers for their recommendations and opinions.
Figure 1 shows the interface of Multisim. The highlighted red box is where the devices are located. With the Multisim V11.0, a lot more devices simulation are supported which includes PLC, and also some PIC16F microcontrollers.
Figure 1: Multisim Interface
Having devices is not sufficient to get data. Thus, Multisim includes various virtual instruments such as oscilloscope, multimeter and spectrum analyzer. Some of these instruments are based on instrument manufacturers such as Agilent and Textronix. Figure 2 shows the various instrument toolbar located at the right.
Figure 2: Instrument toolbar
Below is an example of a Bar Graph Display of AC signal. The AC signal will be produced by the signal generator and the signal wil be measured by an oscilloscope. Additionally, the amplitude of the signal will determine the display of the Bar graph. Devices and virtual instrument can be easily selected from the device toolbar and the instrument. The devices and instrment which are selected is put into the layout and connected.
Figure 3: Simple circuit example
Based on Figure 4, the oscilloscope which is used is from agilent. Besides that, the model also have the same layout of the original model.
Figure 4: Simulation of the circuit on oscilloscope
The signal generator which is used here is also from agilent which has the same layout as the original hardware.
Figure 5: Signal generator
Figure 6 shows the simulation. During simulation, you can manipulate the virtual instruments and view the results similar to what is shown on the oscilloscope and other output devices on the layout.
Figure 6: Result of the signal generator in oscilloscope
Conclusion
With this simulation software, circuit design and testing can be simplified as real hardware is not required. And the analysis can be done remotely with other engineers and designers for their recommendations and opinions.
Thursday, July 7, 2011
Setting up Vbox
VM Virtual box allows you to have one or more OS running at the same time. Here, the Virtual Box is setup for Fedora so that it runs in Windows XP. Having a Linux based system is essential especially Fedora as it consist of electronic spin, which has many Electronic Design Aid (EDA) tools to be utilized. Furthermore, Linux and the software that comes with it is open source.
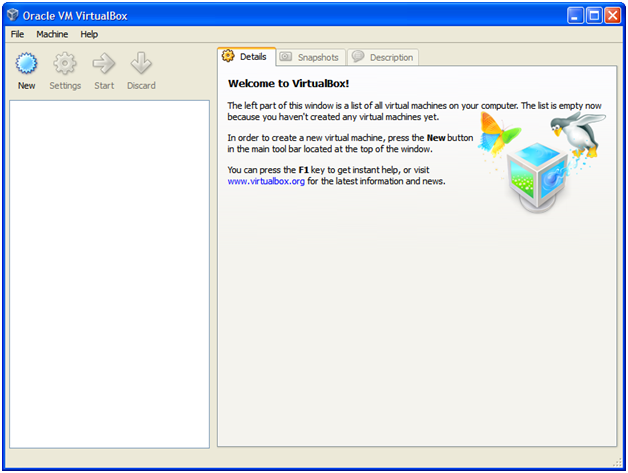
Figure 1: Interface to Vbox
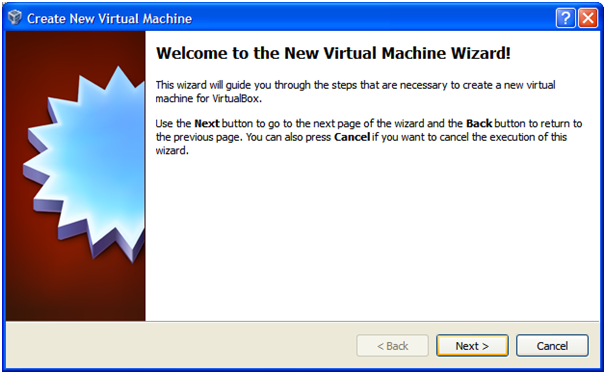
Figure 2: New Virtual Machine Wizard

Figure 3 VM Name and OS
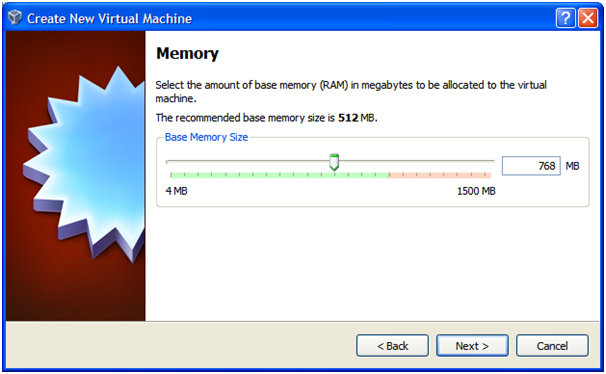
Figure 4: RAM memory allocation
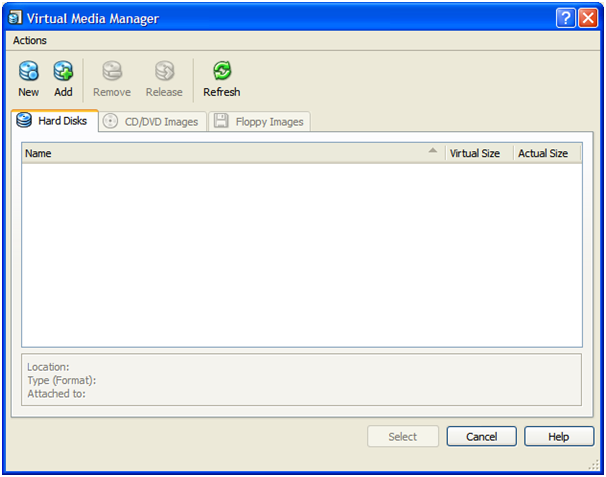
Figure 5: Media manager
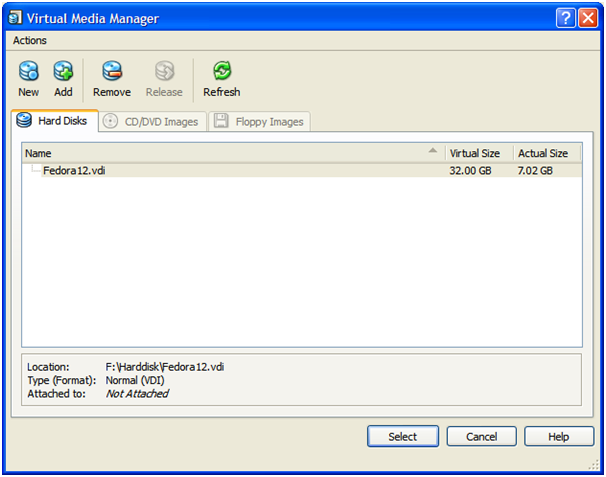
Figure 6: Select the appropriate image file
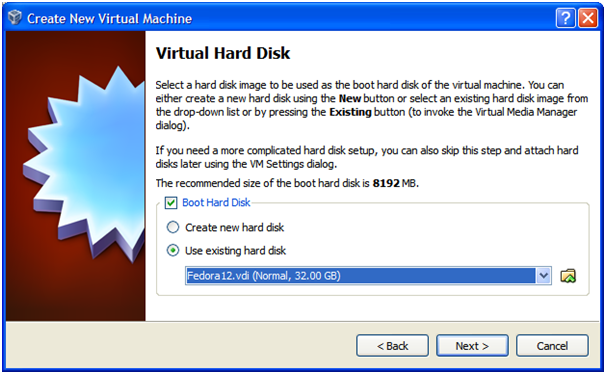
Figure 7: Virtual Hard disk
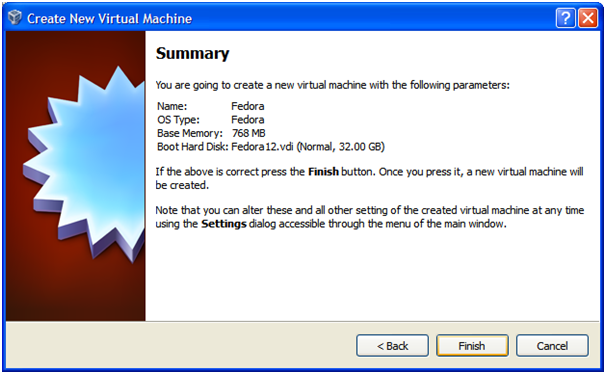
Figure 8: Summary

Figure 9: Final step
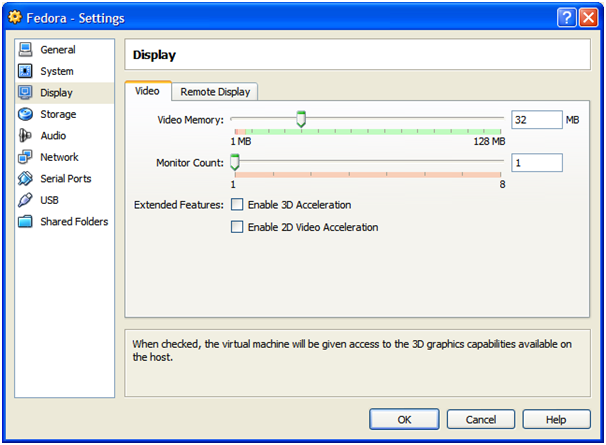
Figure 10: Video Memory
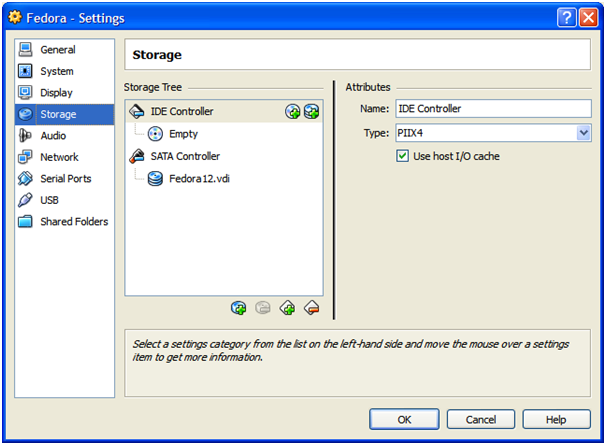
Figure 11: Storage
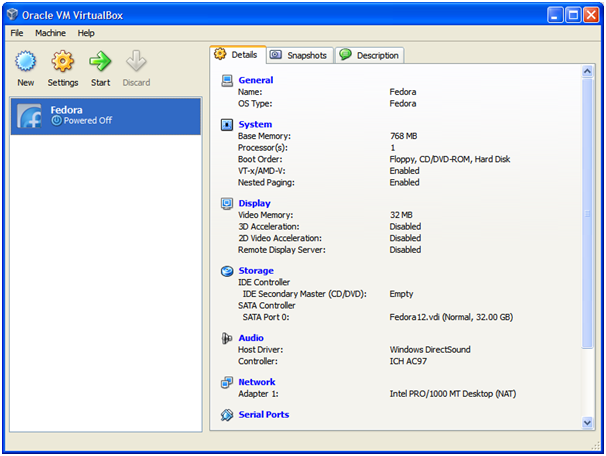
Figure 12: Vbox ready to use
Having a Virtual Box set up in your system allows you to change from Windows OS to Linux OS quickly. This allows you to use software that needs Linux OS.
Steps in setting up VBox
- Install VM VBox software just like any other software.
- Open Oracle VM VirtualBox. You should see the figure below:
Figure 1: Interface to Vbox
- Click on New. Figure 2 will pop out.
Figure 2: New Virtual Machine Wizard
- Click Next. Choose the VM Name and OS type to be loaded to the VM VBox.
Figure 3 VM Name and OS
- Allocate about 768MB of RAM memory to load the fedora. It should be more than sufficient. Click Next.
Figure 4: RAM memory allocation
- Click Add. A dialog should appear. Navigate to the .vdi image file and click OK to complete.
Figure 5: Media manager
- Click Select.
Figure 6: Select the appropriate image file
- If you have the correct image file in the Use existing hard disk list, click Next.
Figure 7: Virtual Hard disk
Figure 8: Summary
- You should have an interface that looks like Figure 9.
Figure 9: Final step
- Click on Settings. Navigate to display -> Video. Set video memory to 32MB. Click OK.
Figure 10: Video Memory
- Go to Storage. Make sure you have the same settings as Figure 11. Click OK.
Figure 11: Storage
- If you have done up to this, you should get Figure 12. Press Start and Fedora will be loaded.
Figure 12: Vbox ready to use
Conclusion
Having a Virtual Box set up in your system allows you to change from Windows OS to Linux OS quickly. This allows you to use software that needs Linux OS.
Starter to LabView
Labview is software, which can be interfaced to hardware to grab data and manipulate them in PC. Labview is easy to use as it is more focus on drag and drop programming. Additionally, coding interface is also provided for those who want to customize their codes.
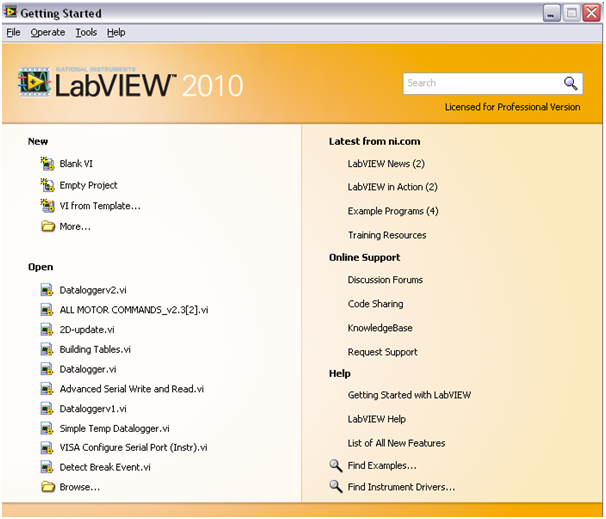
Figure 1: Labview Interface
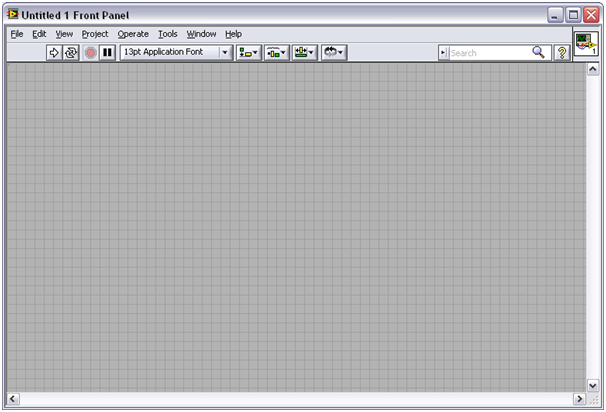
Figure 2: Labview Front Panel
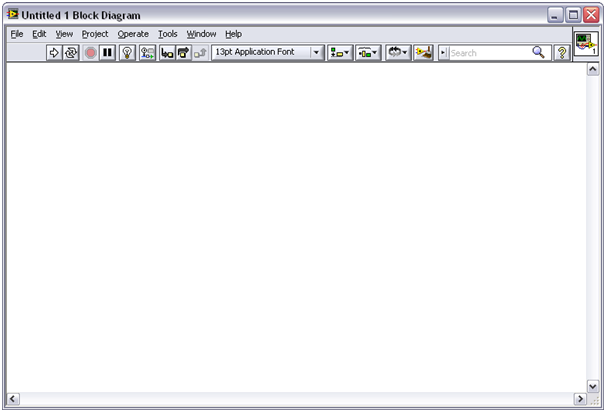
Figure 3: Labview Block Diagram
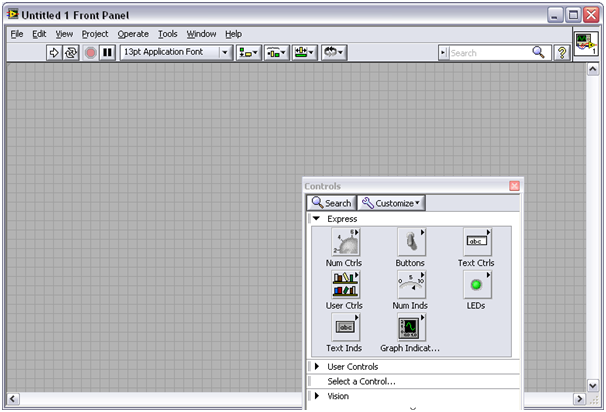
Figure 4: Selecting knob display
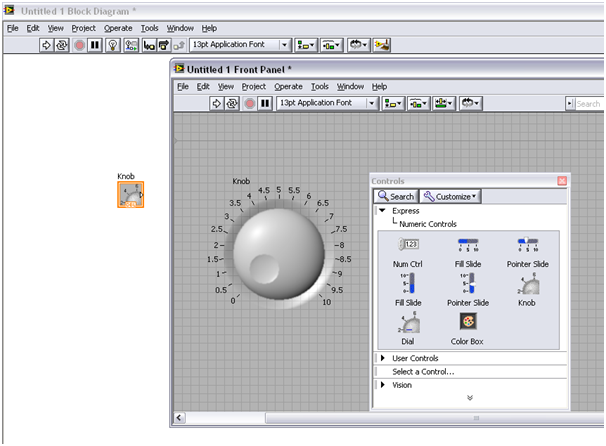
Figure 5: View after the display is added
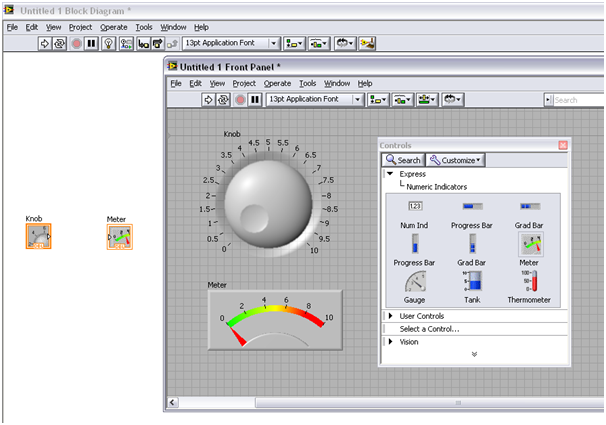
Figure 6: A meter display is added
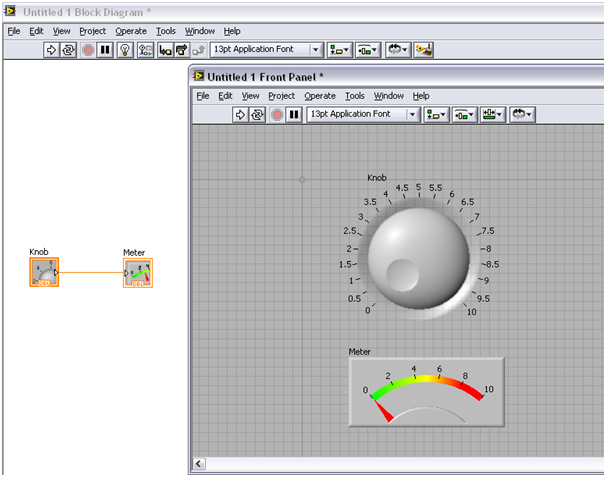
Figure 7: Connecting the Knob to the Meter
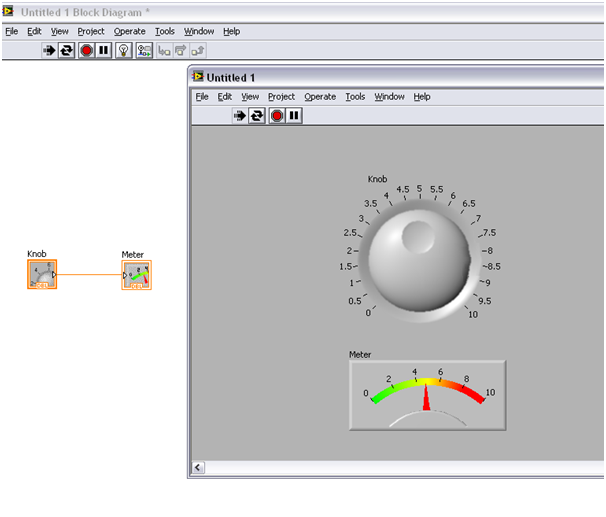
Figure 8: Result of the Meter controlled by the knob
Labview is an interesting software. Further exploration of the software will fully unleash the capability of this software.
How to use Labview
- Figure 1 shows the main Labview interface. Select Blank VI.
Figure 1: Labview Interface
- After Blank VI is selected, there are 2 interface : Front panel, which you use to develop your GUI and Block Diagram which does all the manipulations and data processing. Here, simple program using a knob controlling a meter will be developed.
Figure 2: Labview Front Panel
Figure 3: Labview Block Diagram
Figure 4: Selecting knob display
- Right click -> Express -> Numeric Controls - > Knob. Place it on the Front Panel. You can enlarge the knob and also change its properties by Right Click on the knob -> properties. Figure 5 shows what you should have on both Block Diagram and Front Panel.
Figure 5: View after the display is added
- Next, a meter display is added. Right click -> Express -> Numeric Indicator - > Meter. Figure below shows both the knobs and meter in both front panel and block diagram.
Figure 6: A meter display is added
- To make the meter to correspond to the knob, connect the blocks in the block diagram together by clicking on the arrow indicator then, click on the arrow indicator in another block, which is to be connected. Figure 7 will show the layout you should have after you connect the knob to the meter.
Figure 7: Connecting the Knob to the Meter
Figure 8: Result of the Meter controlled by the knob
- Click on the icon before the red stop button to run the program continuously. Turning the knob will result in the meter displaying the knob value.
Conclusion
Labview is an interesting software. Further exploration of the software will fully unleash the capability of this software.
Verifying the PCB
Homemade PCB are usually soldered without verifying for their broken traces and short circuit connections. Though, this will take more time to finish but, it is to make sure that your PCB is working properly. Thus, after that, if anything goes wrong, you can focus mainly on wrong component placement.
To perform the PCB verification test, simply compare the PCB with the layout. During this stage, you might also want to test the connectivity of each traces to ensure no broken traces by using the diode function in the multimeter especially those with buzzer sound. This will ease the verification process as once we hear the buzzer sound, you will know that the trace is connected from one end to another. To check for shorts, look at any suspicious traces that are too close and test using diode function in the multimeter as well. This time, if your buzzer sounds, then you know there is an unwanted shorts.
By doing these tests , it will help you to finish a working project faster. Additionally, this will also prevent components from damaged due to the short circuits.
To perform the PCB verification test, simply compare the PCB with the layout. During this stage, you might also want to test the connectivity of each traces to ensure no broken traces by using the diode function in the multimeter especially those with buzzer sound. This will ease the verification process as once we hear the buzzer sound, you will know that the trace is connected from one end to another. To check for shorts, look at any suspicious traces that are too close and test using diode function in the multimeter as well. This time, if your buzzer sounds, then you know there is an unwanted shorts.
Conclusion
By doing these tests , it will help you to finish a working project faster. Additionally, this will also prevent components from damaged due to the short circuits.
Monday, July 4, 2011
H Bridge
H-bridge is a circuit configuration that allows the designer to apply the voltages in both directions. H-bridge also allows higher voltage and current to be applied to the load while controlling the direction through a low voltage signal. The illustration below shows the flow of the H-bridge.
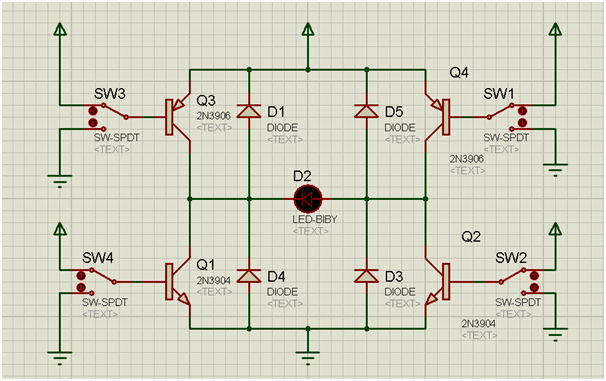
Figure 1: H-bridge circuit diagram
Above Figure 1 is the diagram for the H-bridge. Switches that are used to control the logic level are SW1, SW2, SW3, and SW4. D1, D3, D4, and D5 diodes are used to protect the reverse flow. The circuit in Figure 1 shows that the supplies to the load a well as the control are tied together. However, this can be separated if the load requires additional current and voltage. Both Figure 1 and Figure 2 shows the supply voltage in 2 different direction.
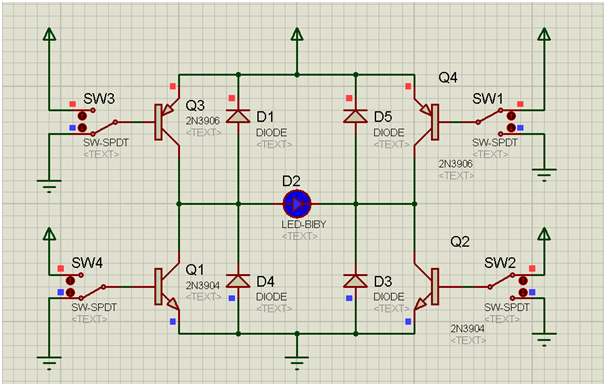
Figure 2: Q3 low Q2 high
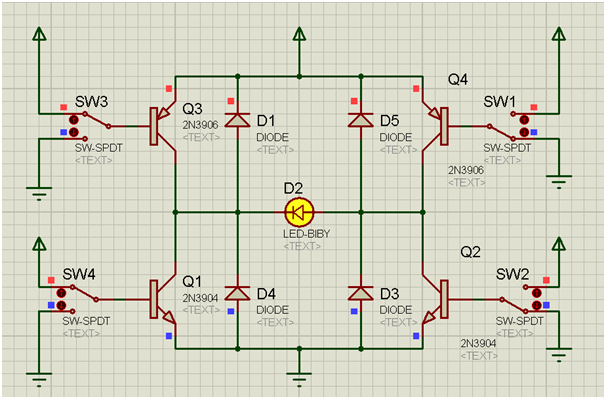
Figure 3: Q4 low Q1 high
The circuits below will show the H-Bridge implementation using 2 switches instead of 4.
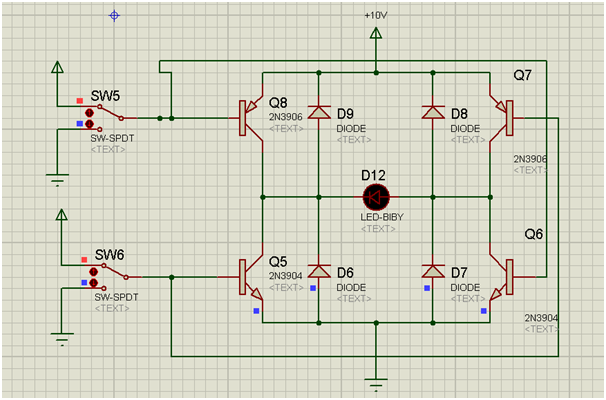
Figure 4: Controlling with 2 input
Figure 5 shows when SW5 and SW6 are low.

Figure 5: SW5, SW6 low
In order for the H-Bridge to work, either one of the switch SW5 or SW6 has to be high while the other switch has to be low.
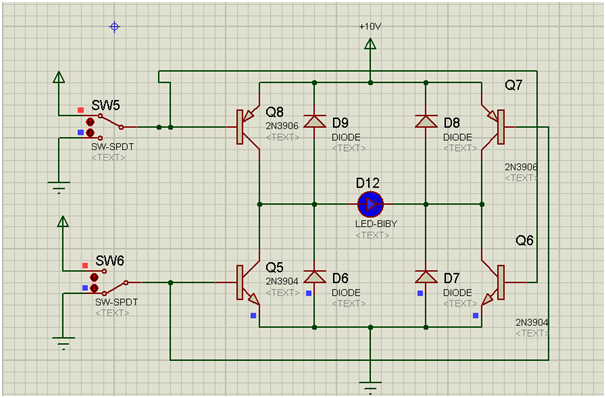
Figure 6: SW5 high, SW6 low
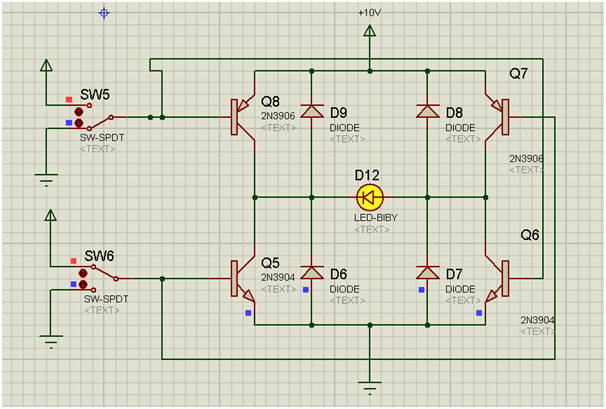
Figure 7: SW5 low, SW6 high
The discussion above shows the implementation of the H-bridge to control direction. This can be used to control motor in both direction by controlling the switches. The proteus simulation above is used to test, debug as well as simulate the concept of the circuit to make sure that the circuit is workable.
Figure 1: H-bridge circuit diagram
Above Figure 1 is the diagram for the H-bridge. Switches that are used to control the logic level are SW1, SW2, SW3, and SW4. D1, D3, D4, and D5 diodes are used to protect the reverse flow. The circuit in Figure 1 shows that the supplies to the load a well as the control are tied together. However, this can be separated if the load requires additional current and voltage. Both Figure 1 and Figure 2 shows the supply voltage in 2 different direction.
Figure 2: Q3 low Q2 high
Figure 3: Q4 low Q1 high
The circuits below will show the H-Bridge implementation using 2 switches instead of 4.
Figure 4: Controlling with 2 input
Figure 5 shows when SW5 and SW6 are low.
Figure 5: SW5, SW6 low
In order for the H-Bridge to work, either one of the switch SW5 or SW6 has to be high while the other switch has to be low.
Figure 6: SW5 high, SW6 low
Figure 7: SW5 low, SW6 high
Conclusion
The discussion above shows the implementation of the H-bridge to control direction. This can be used to control motor in both direction by controlling the switches. The proteus simulation above is used to test, debug as well as simulate the concept of the circuit to make sure that the circuit is workable.
Using Serial UART
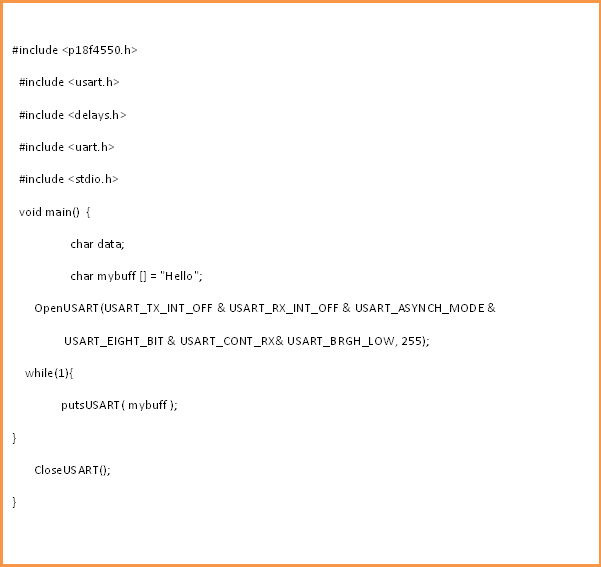
UART is an essential interface to PC. Below shows how to use and set the configuration bits in C18. The purpose of the codes below is to loop back to the Hyperterminal the word "Hello" to make sure the settings of the PIC works accordingly. OpenUSART() function is provided by C18 and it is used to set the neccessary registers in PIC18F series microcontroller.

For some that uses a USB to Serial converter, they are required to test the converter is working properly. Some have been reported not working. The converter can be test by connecting pin 2 and pn 3 together. This allows the data sent from Hyperterminal to loop back to the terminal. After this is done, the above codes can be used to make sure the serial is function properly.
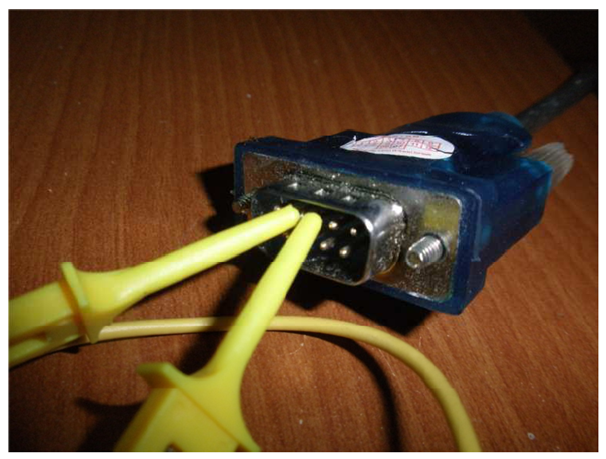
Figure 1: Connecting pin 2 and pin 3 of seriall
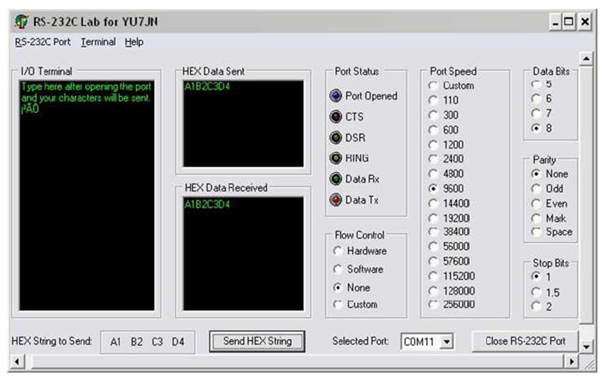
Figure 2: Terminal showing the loop back
These test allows you to save time by debugging the necessary erroneous parts in your development.
For some that uses a USB to Serial converter, they are required to test the converter is working properly. Some have been reported not working. The converter can be test by connecting pin 2 and pn 3 together. This allows the data sent from Hyperterminal to loop back to the terminal. After this is done, the above codes can be used to make sure the serial is function properly.
Figure 1: Connecting pin 2 and pin 3 of seriall
Figure 2: Terminal showing the loop back
Conclusion
These test allows you to save time by debugging the necessary erroneous parts in your development.
Simple power supply for PIC MCU
The power supply for PIC is either 5V or 3.3V. Let us begin with simple 5V regulated power supply. Figure 1 illustrates Proteus simulation for the 5V supply. Note that the supply voltage to the 7805 has to be at least 2V from the regulated voltage. Thus, in this case, the supply voltage has to be 7V and above.
In some cases, you might want to use it with PIC24F and also dsPIC devices that needs 3.3V. Thus, it is better to have both 3.3V and 5V.
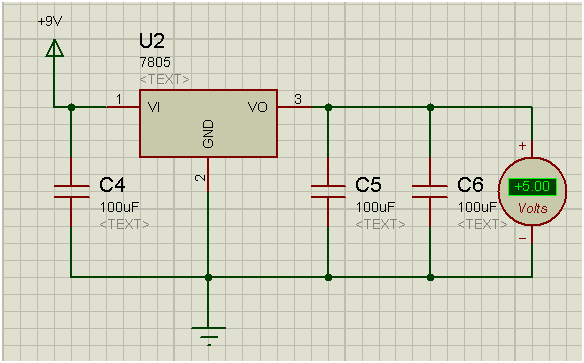
Figure 1: 5V using 7805
Figure 2 and figure 3 shows a simple circuit that will provide 5V and 3.3V. Here, a voltage divider is used to convert the 5V to 3.3V. The switch, SW1 can be replaced with a 3-pin connector. Thus, this will enable you to have, 5V, 3V and GND on the 3 pins.
Figure 2 shows direct output 5V from the regulator while Figure 3 shows the output from the regulator is passed through a voltage divider to get 3.3V.

Figure 2: Direct output from regulator
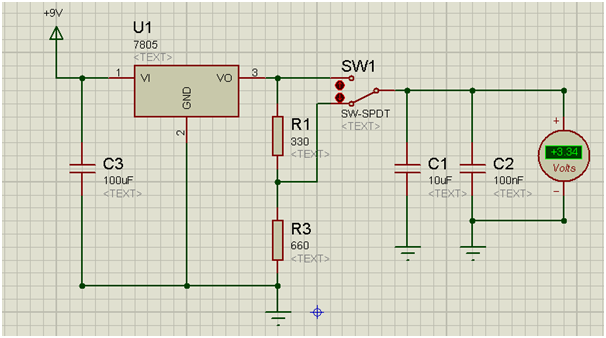
Figure 3: Output from a regulator through a voltage divider
Having 5V and 3.3V, power supply could be very handy. IC's such as PIC24F would require 3.3V while Max232 requires 5V. Therefore, in this case, you would require both 5V and 3.3V
In some cases, you might want to use it with PIC24F and also dsPIC devices that needs 3.3V. Thus, it is better to have both 3.3V and 5V.
Figure 1: 5V using 7805
Figure 2 and figure 3 shows a simple circuit that will provide 5V and 3.3V. Here, a voltage divider is used to convert the 5V to 3.3V. The switch, SW1 can be replaced with a 3-pin connector. Thus, this will enable you to have, 5V, 3V and GND on the 3 pins.
Figure 2 shows direct output 5V from the regulator while Figure 3 shows the output from the regulator is passed through a voltage divider to get 3.3V.
Figure 2: Direct output from regulator
Figure 3: Output from a regulator through a voltage divider
Conclusion
Having 5V and 3.3V, power supply could be very handy. IC's such as PIC24F would require 3.3V while Max232 requires 5V. Therefore, in this case, you would require both 5V and 3.3V
Sunday, February 6, 2011
Firmware portability goes higher as MCU goes better
From PIC24F onwards, the softwae portability increases when programmer uses the build in functions in port.h such as mPORTxConfig() in C30.
Saturday, February 5, 2011
MPLAB goes X = MPLABX
Newly netbean based will have ellipse look will code auto complete as well as graphical function view.In addition, you will now have history. Place that stores all the changes that you have done on the project. If you want to try it, do grab them from the link.
Need a download manager? Try Jdownloader
Jdownloader might not download as fast as Internet Download Manager (IDM), but it sure has some impressive function : auto queue for most ftp hosting from rapidshare to data.hu. All you need to do is to copy and paste the link to the Jdownloader and it will automatically download for you. Once you woke up from a good sleep, all your files are ready for you to view :D
Multiple project compilation for MPLAB
In default, MPLAB is configured for one to one workspace compilation. To enable the multiple workspace:
Configure -> Settings -> Projects -> 'untick' use one to one project-workspace model
Configure -> Settings -> Projects -> 'untick' use one to one project-workspace model
Sunday, January 30, 2011
Source Management Software
Tortoisehg is one of the source management software that is very useful for programmers. All you need to do is to commit to the repository the changes you have made to the file. Using the hg explorer, you can view the older files and you can update your source file to the current workable source file.
tortoisehg-1.1.4-hg-1.6.4-x86.msi.html
tortoisehg-1.1.4-hg-1.6.4-x86.msi.html
Friday, January 28, 2011
PCB layout tools
Eagle PCB
A lite version is available for free. Full licensed software can be purchased from element14. Components used can be quote directly from element14.
http://www.cadsoftusa.com/
DesignSpark
A free Windows XP, Vista and Windows 7 PCB layout which supports import of eagle PCB libraries and files. Price components used in the layout can be quoted directly through RS
http://www.designspark.com/pcb
Kicad
Software which supports both linux and windows with 3D rendering features.
http://www.lis.inpg.fr/realise_au_lis/kicad/
Thursday, January 27, 2011
Looping in C
There are a few common loops that is used in C: while loop, do while loop and for loop.
while loop:
while (1)
{
};
The while loop above is an infinite loop.
for loop:
for (condition = 0; condition < set value; condition ++)
{
}
This loop is suppose to count up until it meet the condition meet the set value. To make a count down loop, set condition to a value, and as long as the condition > set value, condition -- .
Do while loop:
do
{
}while(condition != 0);
This loop will do at least once to check the condition is met or not. If the condition is not met, the program will exit. The while loop and for loop on the other hand, will check whether the condition is net before executing the program.


Subscribe to:
Posts (Atom)